Georgia Power
Analysis of electricity usage and costs from Georgia Power billing data.
Georgia Power Usage Analysis
A Python script to analyze electricity usage and costs from Georgia Power billing data over multiple years.
Overview
This project analyzes electricity billing data to visualize: - Electricity costs over time - Temperature patterns and their correlation with energy usage - Impact of major life events (moving to a house, installing new windows) on energy consumption
Files
georgia_power_analysis.py- Main analysis scriptGPC_Usage_2021.csv- 2021 billing dataGPC_Usage_2022.csv- 2022 billing dataGPC_Usage_2023.csv- 2023 billing dataGPC_Usage_2024_2025.csv- 2024-2025 billing dataNORMAL_DLY_sample_csv.csv- Weather data (sample)
Features
- Data Processing: Combines multiple years of billing data and calculates daily cost averages
- Dual-Axis Visualization: Shows both cost and temperature trends on the same graph
- Event Markers: Highlights important dates:
- Moving to a house (June 2024)
- Installing new windows (October 2024)
- Comparative Analysis: Separates apartment vs. house energy usage patterns
Requirements
numpy
pandas
matplotlib
Data Format
The script expects CSV files with the following columns:
- Billing Period - Date range or single date for the billing period
- Cost - Total electricity cost for the period
- High Temp - Highest temperature during the period
- Low Temp - Lowest temperature during the period
Output
The script generates a dual-axis line chart showing: - Green lines: Electricity costs (separated for apartment vs. house periods) - Blue line: Average temperature (continuous across all periods) - Red dashed line: House move date - Orange dotted line: New windows installation date
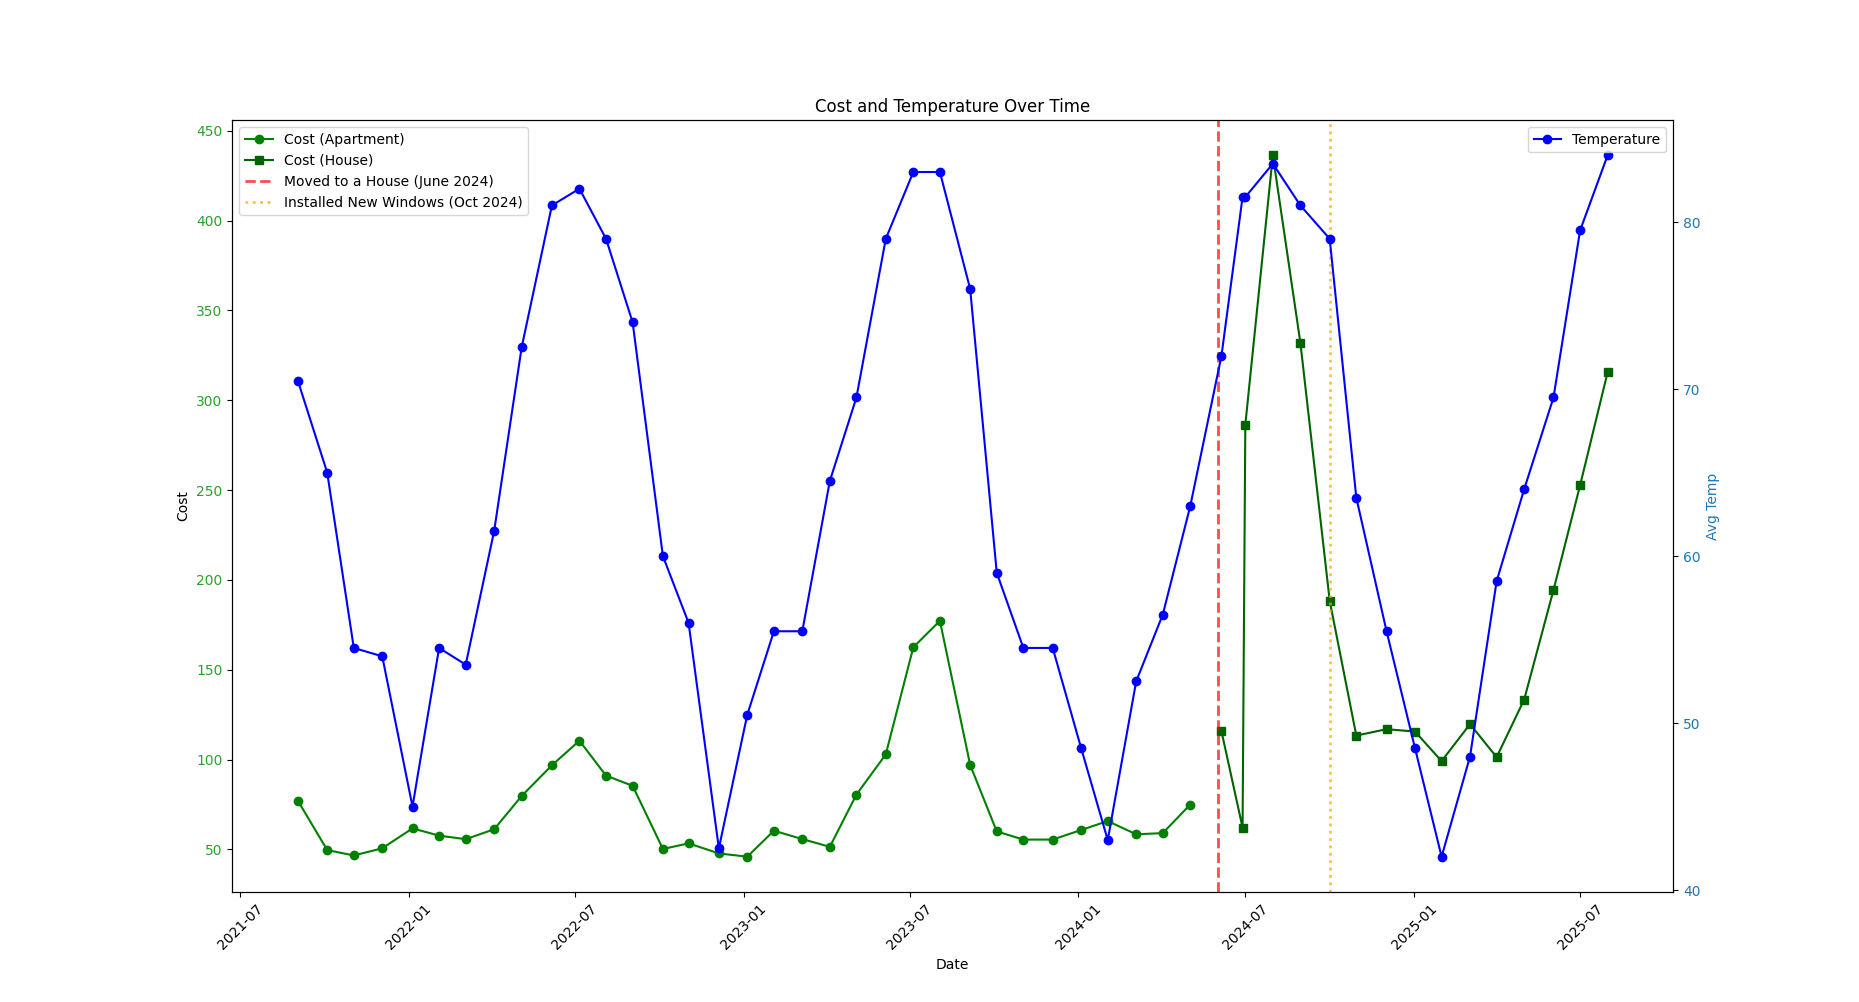
This visualization helps identify seasonal patterns, the impact of housing changes, and energy efficiency improvements over time.