Global Temperatures Analysis
Completion Date: 2024-10-13
Linear Regression Analysis of US Average Temperatures
Project Overview
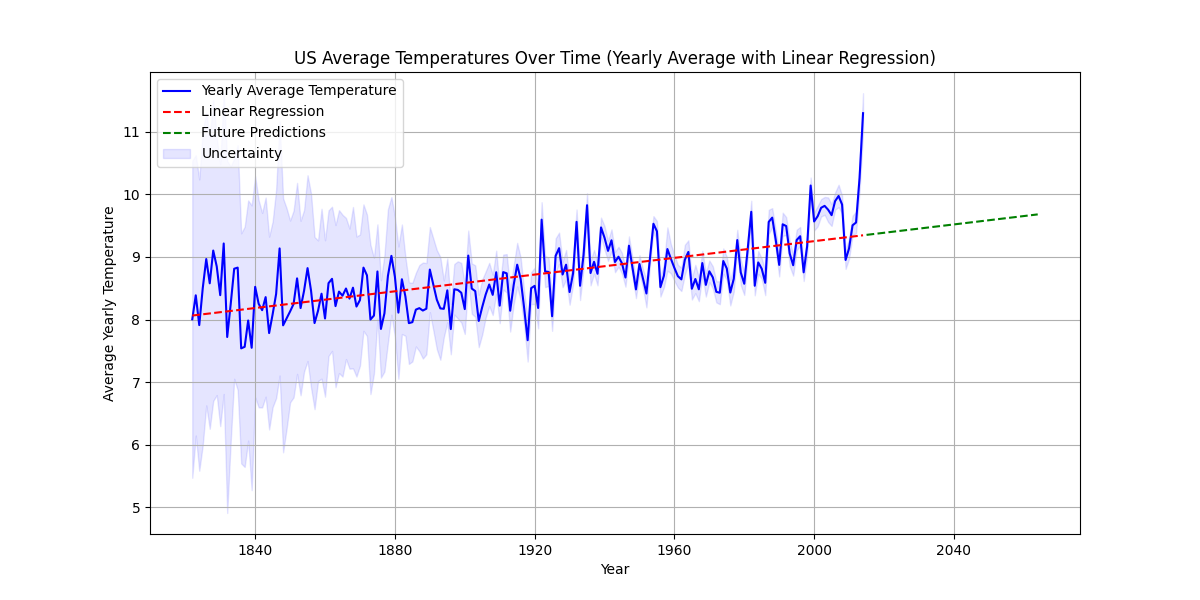
This project analyzes the average temperatures of the United States over time using linear regression. The dataset used is the "GlobalLandTemperaturesByCountry" dataset from Berkeley Earth, which includes monthly temperature records for various countries from 1743 onwards. The project involves data preprocessing, fitting a linear regression model to US temperature data, and visualizing historical trends with 50-year future predictions.
Project Structure
global_temperatures/
├── main.py                              # Main analysis script
├── GlobalLandTemperaturesByCountry.csv  # Temperature dataset
├── global_temps.png                     # Generated visualization
├── README.md                           # Project documentation
├── .gitignore                          # Git ignore file
└── venv/                               # Virtual environment (ignored)
This project analyzes the average temperatures of the United States over time using linear regression. The dataset used is the "GlobalLandTemperaturesByCountry" dataset from Berkeley Earth, which includes monthly temperature records for various countries from 1743 onwards. The project involves data preprocessing, fitting a linear regression model to US temperature data, and visualizing historical trends with 50-year future predictions.
Features
- Data Filtering: Extracts US temperature data and filters out inaccurate records before 1821
- Data Cleaning: Handles missing values using forward fill method
- Temporal Resampling: Converts monthly data to yearly averages for trend analysis
- Linear Regression: Fits a trend line to historical data and predicts future temperatures for 50 years
- Uncertainty Visualization: Displays temperature uncertainty bounds as shaded regions
- Future Predictions: Generates temperature forecasts through 2074
Requirements
- Python 3.7+
- pandas
- numpy
- matplotlib
- scikit-learn
Installation & Setup
-
Clone the repository:
bash git clone <repository-url> cd global_temperatures -
Create and activate a virtual environment (recommended):
bash python -m venv venv venv\Scripts\activate # On Windows source venv/bin/activate # On macOS/Linux -
Install required packages:
bash pip install pandas numpy matplotlib scikit-learn -
Ensure the dataset is present: The
GlobalLandTemperaturesByCountry.csvfile should be in the project root directory.
Usage
Run the main analysis script:
python main.py
This will:
- Load and process the temperature data
- Generate a linear regression model
- Create visualizations showing historical data, trend line, and future predictions
- Save the plot as global_temps.png
Data Source
The dataset comes from Berkeley Earth's temperature analysis and contains: - Coverage: Monthly temperature records from 1743-2013 - Scope: Land temperature data for 243 countries/regions - Format: CSV with columns for date, average temperature, uncertainty, and country - US Data: Approximately 3,240 monthly records for the United States
Tools and Libraries
- Python: Main programming language used for analysis.
- Pandas: Data manipulation and preprocessing.
- NumPy: Numerical operations.
- Matplotlib: Data visualization.
- scikit-learn: Linear regression model.
Results
The analysis produces a visualization showing: - Historical Data: US yearly average temperatures from 1821-2013 - Linear Trend: A fitted regression line indicating gradual warming - Uncertainty Bands: Shaded regions showing temperature measurement uncertainty - Future Projections: 50-year temperature predictions (2014-2074)

Methodology
- Data Preprocessing:
- Filter dataset for US records only
- Remove unreliable data before 1821
-
Handle missing values with forward fill
-
Temporal Aggregation:
- Resample monthly data to yearly averages
-
Calculate yearly uncertainty bounds
-
Model Training:
- Fit linear regression to yearly temperature data
-
Generate 50-year future predictions
-
Visualization:
- Plot historical data with uncertainty bands
- Overlay trend line and future projections
Future Work
The code includes TODOs for implementing additional statistical validations:
- Linearity Testing: Visual inspection and Durbin-Watson test for linear relationship assessment
- Independence Verification: Residual analysis to detect autocorrelation patterns
- Homoscedasticity Check: Residual vs. predicted value plots to verify constant variance
- Normality Testing: Histogram analysis and Shapiro-Wilk test on residuals
- Model Enhancement: Explore polynomial regression or time series models (ARIMA, seasonal decomposition) to capture non-linear temperature patterns
- Advanced Visualization: Consider implementing joyplot-style visualizations for enhanced data presentation
Limitations
- Linear regression assumes a constant rate of temperature change, which may not capture complex climate patterns
- Model doesn't account for cyclical variations, extreme weather events, or policy interventions
- Predictions beyond 2013 should be interpreted cautiously given evolving climate dynamics
Acknowledgments
- Dataset provided by Kaggle.
Author
This project was developed by John Curran.