Wage Distribution Analysis
A statistical comparison of wage distributions over time.
U.S. Household Income Distribution Analysis (2010-2023)
Project Overview
This project analyzes the evolution of household income distribution in the United States from 2010 to 2023 using data from the U.S. Census Bureau's American Community Survey. The analysis examines how the proportion of households in different income brackets has changed over time, revealing significant shifts in the American economic landscape.
Key Finding: The data shows a clear upward mobility trend, with higher income brackets ($75,000+) gaining population share while lower income brackets show declining representation.
Research Questions
This exploratory data analysis addresses several key questions:
- How has household income distribution changed from 2010 to 2023?
- Which income groups experienced the most significant changes?
- What does this tell us about economic mobility and wage growth?
- How has the median household income bracket shifted over time?
Dataset
The analysis uses U.S. Census Bureau American Community Survey (ACS) 1-Year Estimates data (Table S1901) spanning 2010-2023. The dataset contains:
- Source: U.S. Census Bureau American Community Survey
- Coverage: 2010-2023 (excluding 2020 due to data collection issues)
- Scope: Household income estimates by income brackets
- Geographic Level: National (United States)
Income Brackets Analyzed
- Less than $10,000
- $10,000 to $14,999
- $15,000 to $24,999
- $25,000 to $34,999
- $35,000 to $49,999
- $50,000 to $74,999
- $75,000 to $99,999
- $100,000 to $149,999
- $150,000 to $199,999
- $200,000 or more
Methodology
Data Processing
- Data Integration: Combined 13 years of ACS data files into a unified dataset
- Data Cleaning:
- Removed formatting symbols (%, ±, commas) from numeric fields
- Converted percentage strings to numeric values
- Standardized column names for consistency
- Data Validation: Filtered out invalid or missing values to ensure analysis integrity
Analysis Approach
- Trend Analysis: Line plots showing percentage changes over time for each income bracket
- Comparative Analysis: Calculated net change from 2010 to 2023 for each income group
- Median Estimation: Approximated median household income bracket shifts over the study period
Visualization Strategy
The project evolved through multiple visualization approaches: 1. Initial Approach: Ridgeline plots (faceted bar charts by year) 2. Final Approach: Multi-line time series plots for better trend identification
Key Findings
Income Mobility Trends
- Upward Mobility: All income brackets above $75,000 showed increases in household representation
- Declining Lower Brackets: All income brackets below $75,000 experienced decreases
- Median Shift: The estimated median household income bracket moved from "$15,000-$24,999" to "$35,000-$49,999"
Specific Changes (2010-2023)
The analysis reveals that higher-income households have become a larger share of the population, while lower-income households have decreased proportionally, suggesting overall economic improvement during this period.
Results
The analysis produced two key visualizations that illustrate the changing household income distribution over the 13-year study period:
Initial Visualization: Ridgeline Plot
The first approach used a ridgeline-style visualization showing the distribution for each year separately. While this provided a comprehensive view of all years, it made trend identification challenging as viewers had to compare across multiple subplots.
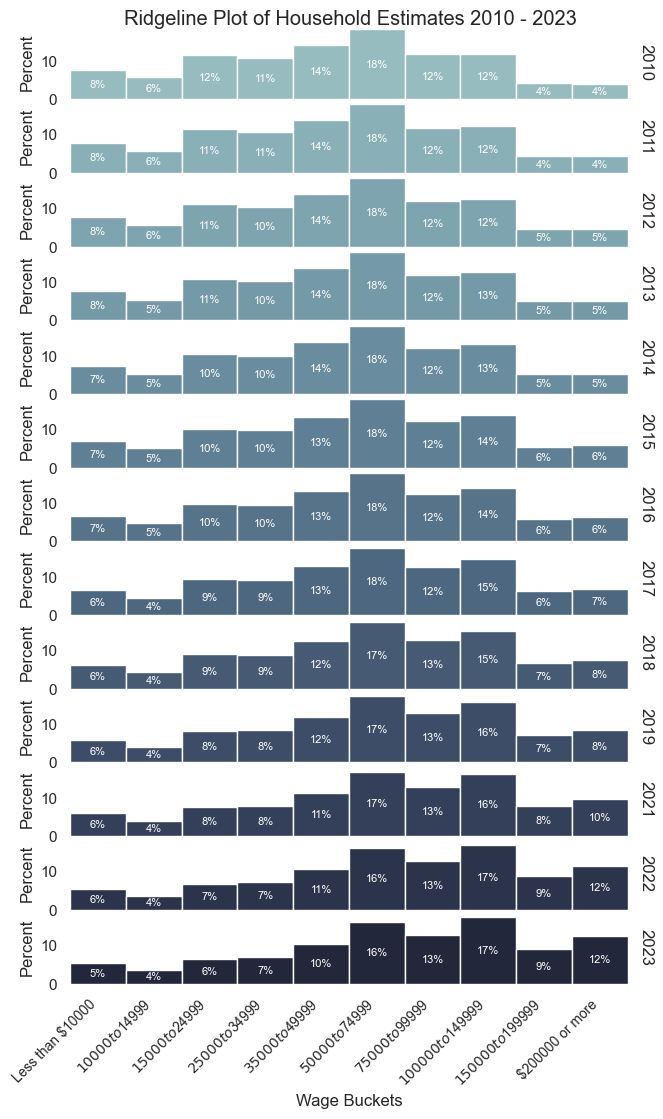
Figure 1: Ridgeline plot showing household income distribution by year (2010-2023). Each row represents a different year, with bars showing the percentage of households in each income bracket.
Final Visualization: Time Series Analysis
The refined approach used a multi-line time series plot that clearly demonstrates the diverging trends between income brackets. This visualization makes the upward mobility pattern immediately apparent.
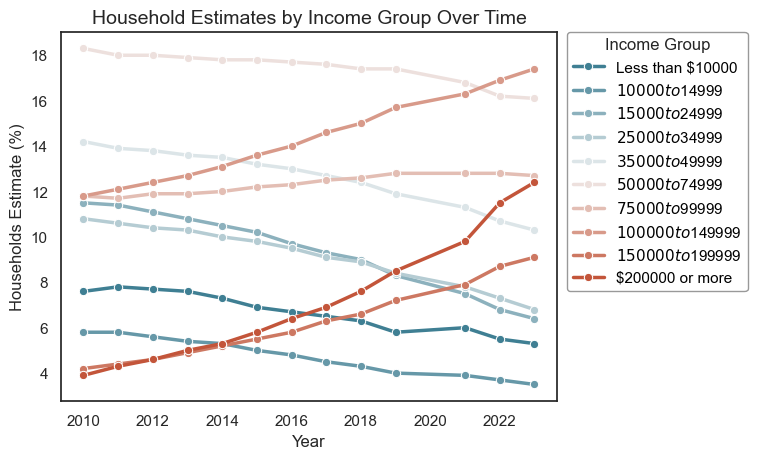
Figure 2: Time series plot showing the evolution of household income distribution from 2010-2023. Higher income brackets (warmer colors) show increasing trends, while lower income brackets (cooler colors) show declining trends.
Key Observations from Visualizations
- Clear Divergence: The time series plot reveals a distinct separation between income brackets above and below $75,000
- Consistent Trends: The trends are remarkably consistent across the entire study period, suggesting structural economic changes rather than temporary fluctuations
- Magnitude of Change: The visualizations show that changes range from approximately 2-4 percentage points across different income brackets
- Crossover Points: Some income brackets intersect over time, indicating shifts in the relative size of different economic segments
Technical Implementation
Tools and Libraries
- Python 3.x: Primary programming language
- Pandas: Data manipulation and analysis
- Matplotlib: Data visualization foundation
- Seaborn: Statistical data visualization
- NumPy: Numerical computing support
Project Structure
wage_distribution/
├── main.ipynb              # Primary analysis notebook
├── readme.md              # Project documentation
└── Data/                  # Census data files (2010-2023)
    ├── ACSST1Y2010.S1901-*.csv
    ├── ACSST1Y2011.S1901-*.csv
    └── ...
Limitations and Considerations
- Aggregated Data: Analysis works with percentage distributions rather than individual household data
- Bracket Constraints: Median calculations are limited to income bracket estimates rather than precise values
- Inflation Adjustment: Analysis uses nominal dollar amounts without inflation adjustment
- Data Gap: 2020 data uses 5-year estimates due to ACS data collection challenges
Future Enhancements
- Inflation Analysis: Adjust income brackets for inflation to measure real wage changes
- Geographic Analysis: Expand to state and metropolitan area comparisons
- Demographic Breakdown: Analyze income distribution by household composition, age, and education
- Economic Context: Correlate findings with major economic events and policy changes
- Statistical Testing: Implement significance tests for observed changes
Data Source
U.S. Census Bureau, American Community Survey 1-Year Estimates, Table S1901: "Income in the Past 12 Months (in 2023 Inflation-Adjusted Dollars)"
URL: https://data.census.gov/table/ACSST5Y2020.S1901?q=S1901 This project analyzes the evolution of household income distribution in the United States from 2010 to 2023 using data from the U.S. Census Bureau's American Community Survey. The analysis examines how the proportion of households in different income brackets has changed over time, revealing significant shifts in the American economic landscape.
Key Finding: The data shows a clear upward mobility trend, with higher income brackets ($75,000+) gaining population share while lower income brackets show declining representation.
Author
John Curran
This project serves as a demonstration of exploratory data analysis methodology, following a narrative approach that documents the analytical thought process from initial data exploration to final insights.